
A pressure-volume loop is a graphical representation that illustrates the relationship between pressure and volume in the heart throughout a single cardiac cycle, providing valuable insights into the heart’s mechanical function and assisting in the diagnosis of various cardiac conditions.
In a pressure-volume loop, the y-axis represents pressure (in mmHg), while the x-axis represents volume (in milliliters). The loop consists of four distinct phases. The first phase, isovolumetric contraction, occurs after the ventricles fill with blood and the mitral and aortic valves close. As the ventricles contract, pressure rises rapidly while the volume remains constant, indicating that no blood is being ejected at this point.
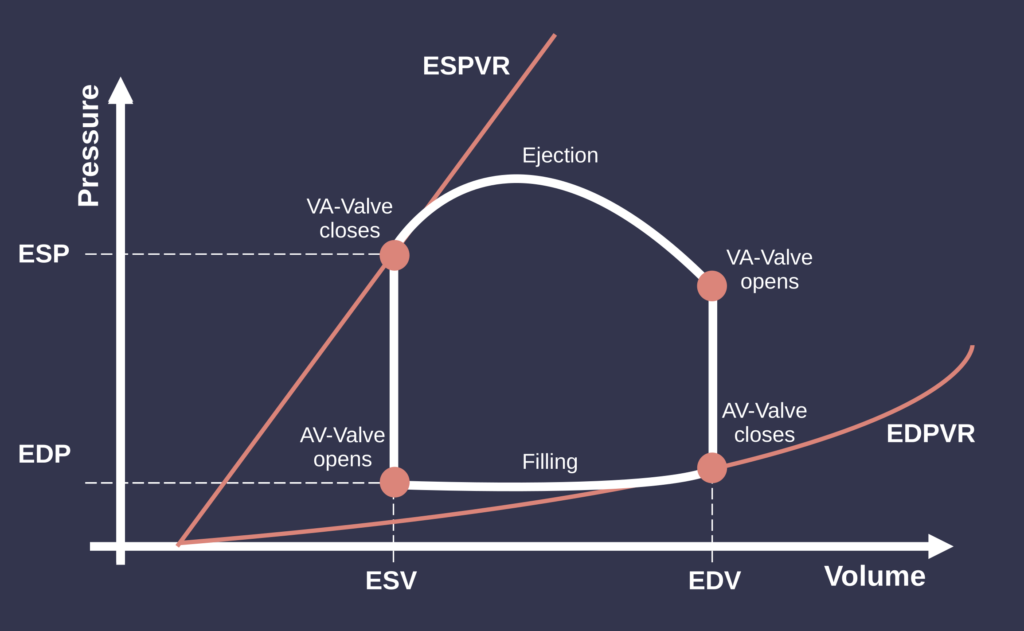
The next phase is ventricular ejection. When the pressure in the ventricles exceeds that in the aorta and pulmonary artery, the aortic and pulmonary valves open, allowing blood to be ejected. During this phase, the volume in the ventricles decreases while the pressure initially rises and then gradually falls as ejection slows.
Following ejection is the isovolumetric relaxation phase. After the ventricles have expelled blood, they begin to relax, causing a rapid drop in pressure while the volume stays the same. This phase prepares the ventricles for filling.
The cycle concludes with ventricular filling, during which the mitral and tricuspid valves open, allowing blood to flow from the atria into the ventricles. Initially, this filling occurs passively, leading to a rapid increase in volume with relatively low pressure. Towards the end of this phase, atrial contraction contributes additional blood to the ventricles, completing the cycle.
A key concept related to pressure-volume loops is the End-Systolic Pressure-Volume Relationship (ESPVR). This relationship describes the connection between pressure and volume in the ventricle at the end of systole, just before the heart relaxes. On the pressure-volume loop graph, the ESPVR is depicted as a straight line. The slope of this line reflects the ventricle’s contractility: a steeper slope indicates better contractility, while a flatter slope suggests impaired function. Notably, the ESPVR is relatively independent of loading conditions (preload and afterload), making it a useful measure for evaluating myocardial performance.
The slope of the filling phase also provides insights into the ventricle’s compliance, or ease of filling. Decreased compliance can indicate stiffer ventricles, often seen in conditions like hypertrophy or fibrosis. Additionally, the characteristics of the filling phase can reveal information about diastolic function, which may be affected by aging and other heart diseases.
Pressure-volume loops and the ESPVR are valuable for assessing heart function. Changes in the shape and size of the loop can signal various cardiac conditions; in heart failure, for example, the loop may become smaller, indicating reduced stroke volume and impaired contractility.