
We are excited to announce the launch of our free to use online single-beat analyzer, now available at www.hemodynamix.com. In this blog post, we will provide an overview of its features and demonstrate how it can be effectively utilized.
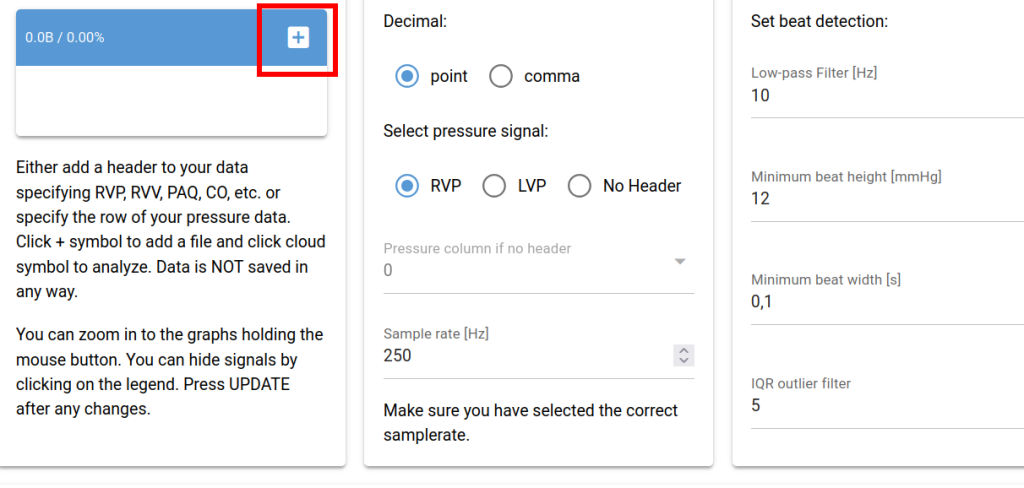
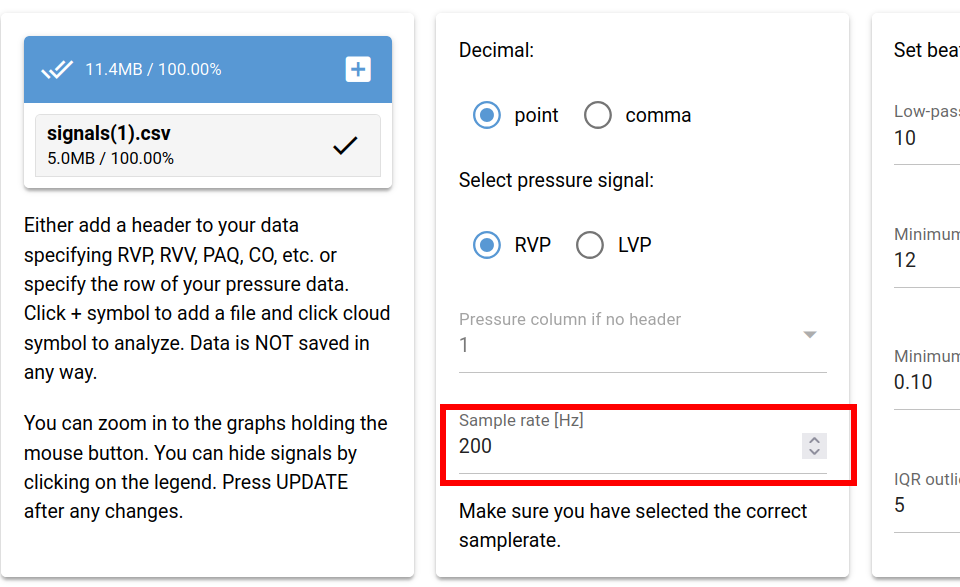
When you open the analyzer page, the first step is to upload a suitable CSV or TXT file containing right or left ventricular pressure curves. The analyzer supports both point and comma as decimal separators, so ensure you are aware of your file’s formatting before proceeding. To select a file, click the PLUS symbol in the file upload widget located on the left side of the page.
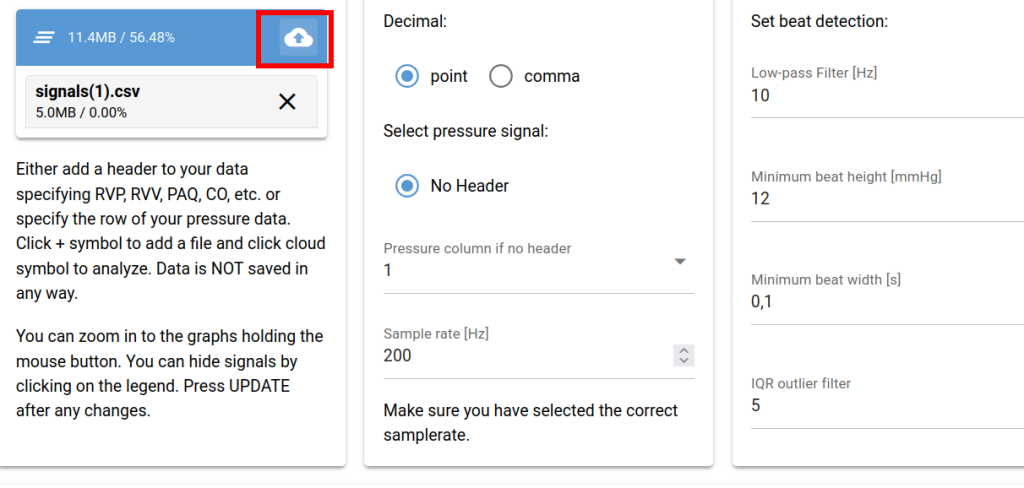
Click the CLOUD icon to upload the selected file.
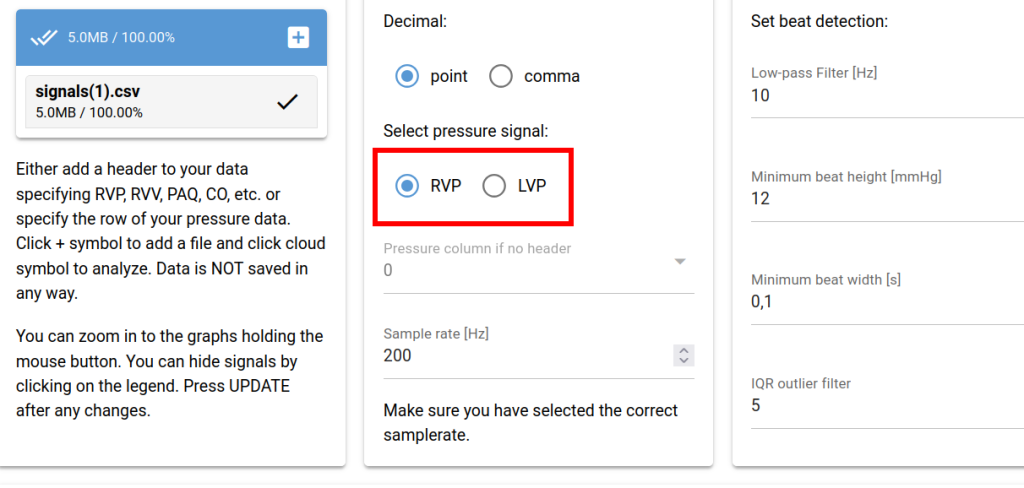
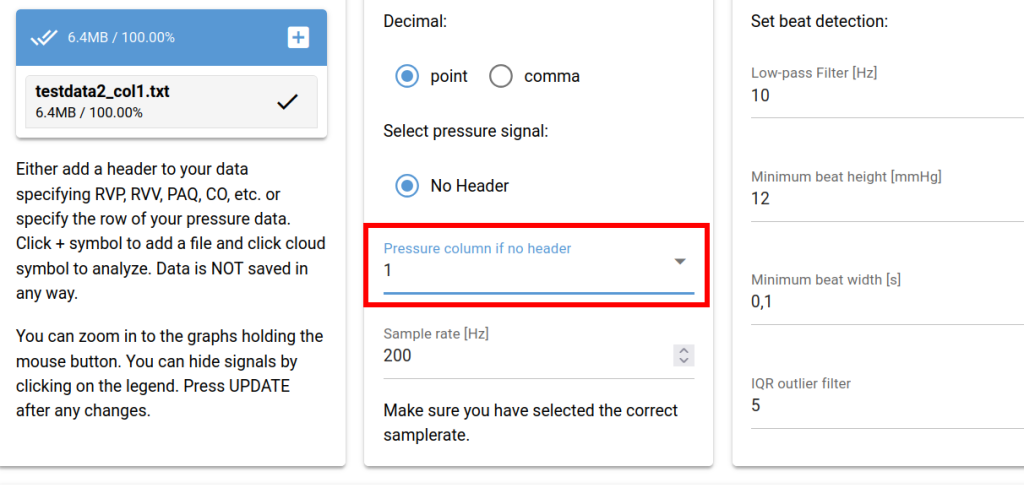
The analyzer then determines whether the uploaded file includes a header. A header indicates that the first row of the file contains column names. For instance, a three-column file with time, pressure, and volume data might have a header like TIME RVP RVV. Files using naming conventions such as RVP, LVP, RVV, LVV, CO, or AOQ are automatically recognized. If the file lacks a header or uses unrecognized naming conventions, it will be categorized as “No header.” For such files, you can manually select the column containing the pressure signal.
An example of a file where both RVP and LVP signals are detected:
Example of a file with no header:
After successfully loading your data, the pressure signal and its derived signals will be displayed below the menu.
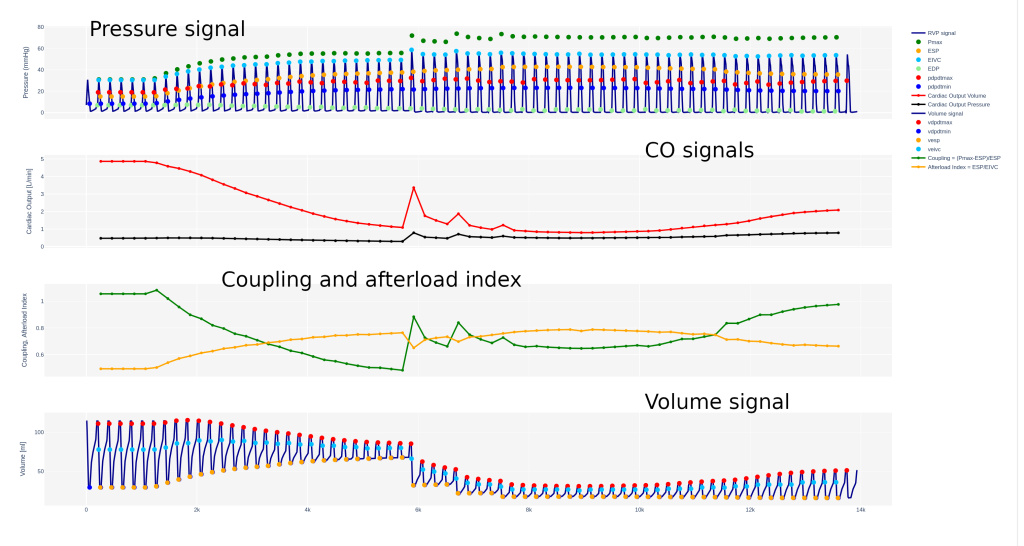
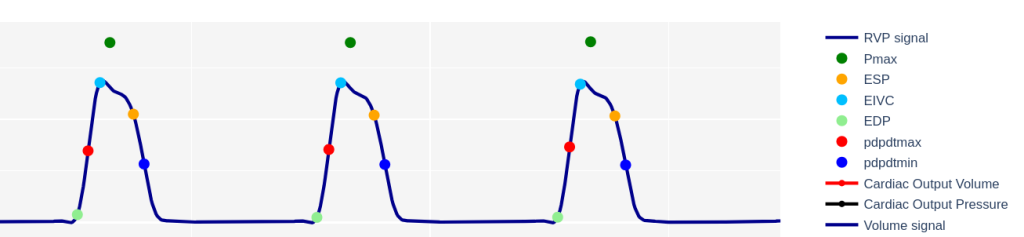
The analyzer automatically identifies key pressure points within the signal, including pdpdtmax, pdpdtmin, EDP, ESP, and EIVC. Using these points, the isovolumic pressure Pmax is calculated and displayed above the pressure signal. Pmax is calculated based on the methodology outlined in https://doi.org/10.1002/ehf2.14833.
In this example, the file includes a volume signal, which is displayed in the fourth graph. If the uploaded file contains a volume signal, a flow signal, or a direct cardiac output (CO) reference signal, the analyzer calculates a reference cardiac output signal, which is displayed in the second graph.
The third graph contains the signals ventricular arterial coupling which is calculated as (Pmax-ESP)/ESP and the variable afterload index which is calculated as ESP/EIVC.
After loading your data, the first step is to ensure that the correct sample rate is set. You can adjust the sample rate in the second menu tab.
Next, you can adjust the beat detection parameters to ensure that your pressure beats are accurately identified.
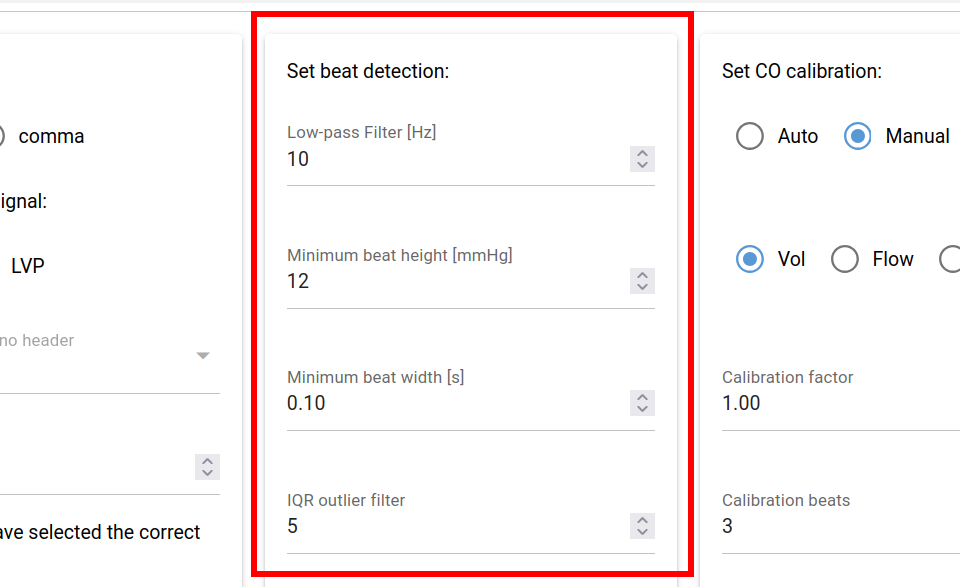
The first option in this menu is the low-pass filter. A frequency of 10 Hz is typically appropriate. Increasing the frequency will introduce more noise into your signal, while decreasing it will cause the pressure waveform to become increasingly sinusoidal due to the loss of higher frequencies.
The “Minimum beat height” defines the minimum height of a pressure peak required for it to be detected.
The “Minimum beat width” specifies the minimum distance between two pressure beats for them to be considered separate events.
Lastly, the IQR outlier filter applies an interquartile range filter, defined as a percentage. Increasing the IQR filter percentage will remove more of the signal that deviates significantly from the expected range.
Adjust this parameter based on the characteristics of your signal.
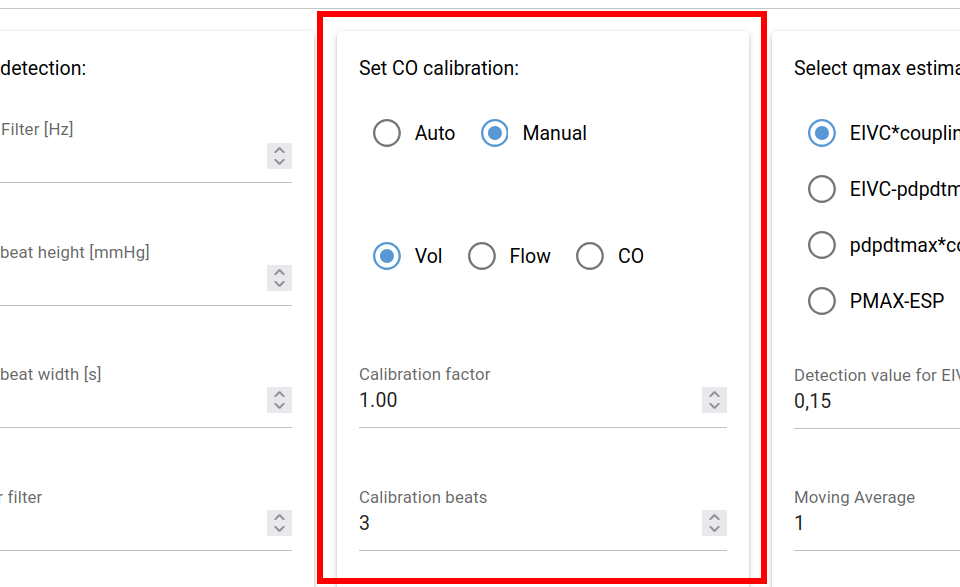
The third menu tab defines the cardiac output signal calibration. The analyzer calculates a cardiac output signal directly from the pressure signal. This signal can be calibrated either automatically, using an existing reference signal, or manually by adjusting the calibration factor. For automatic calibration, the process is based on the values of the first N beats of the reference signal, where N can be set at the bottom of this menu tab.
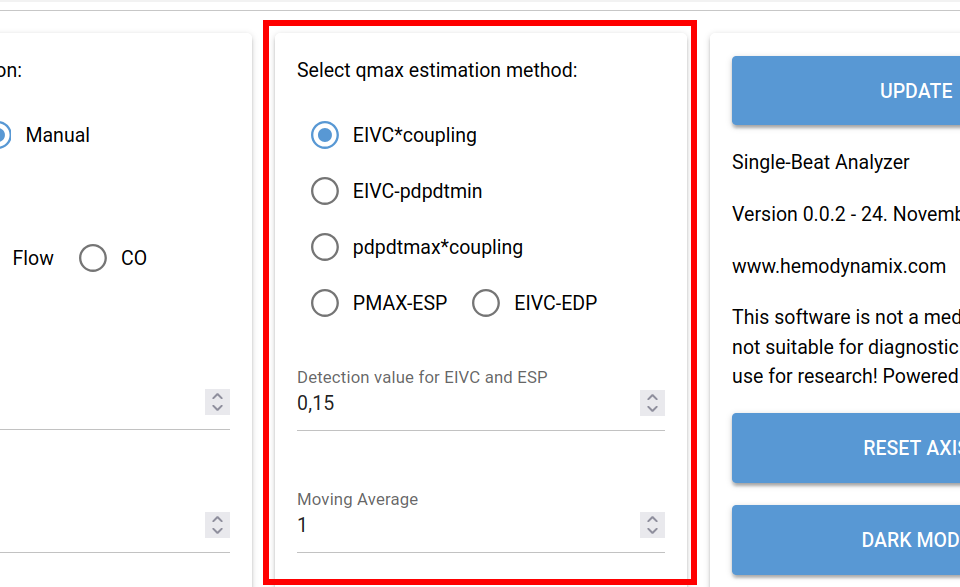
The fourth menu tab allows you to select the method for estimating Qmax to calculate the cardiac output signal from pressure. Additionally, you can adjust the detection parameters for both EIVC and ESP. Lowering the detection value will shift both EIVC and ESP lower on the pressure curve, while increasing it will shift them higher. A moving average, which can be set at the bottom of the menu tab, is applied to the cardiac output, coupling, and afterload index signals.
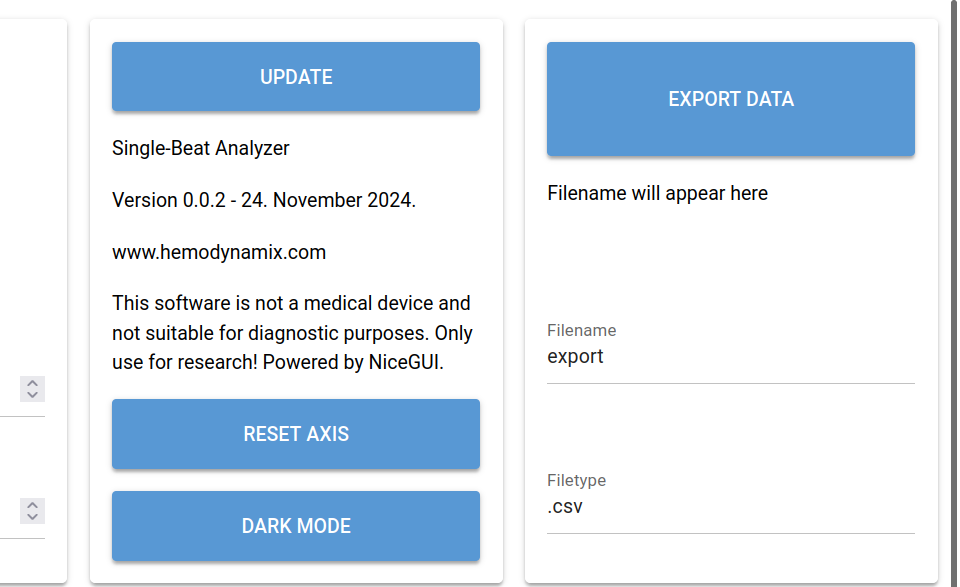
Click the UPDATE button after making any changes to the menu settings to refresh the graphs. The RESET AXIS button rescales all graphs to display the full data. DARK MODE toggles between light and dark themes.
You can export the pressure signal, Pmax, ESP, and EDP by clicking the EXPORT DATA button.
If you have any questions or feedback about the analyzer, please don’t hesitate to contact us through the contact form on this website. Additionally, if you’d like to test the analyzer but don’t have suitable data, you are welcome to use the sample data available in the Resources section of the website.