
We’re excited to announce the next major update to the Hemodynamix Online Analyzer, designed to support advanced hemodynamic waveform interpretation with enhanced precision, flexibility, and usability. Here’s an overview of the key new features and what they mean for users:
1. Flow and Volume Signal Generation from Ventricular Pressure
The new release introduces automated generation of flow and volume waveforms derived from ventricular pressure data. This enables deeper physiological insights without the need for additional sensor input.
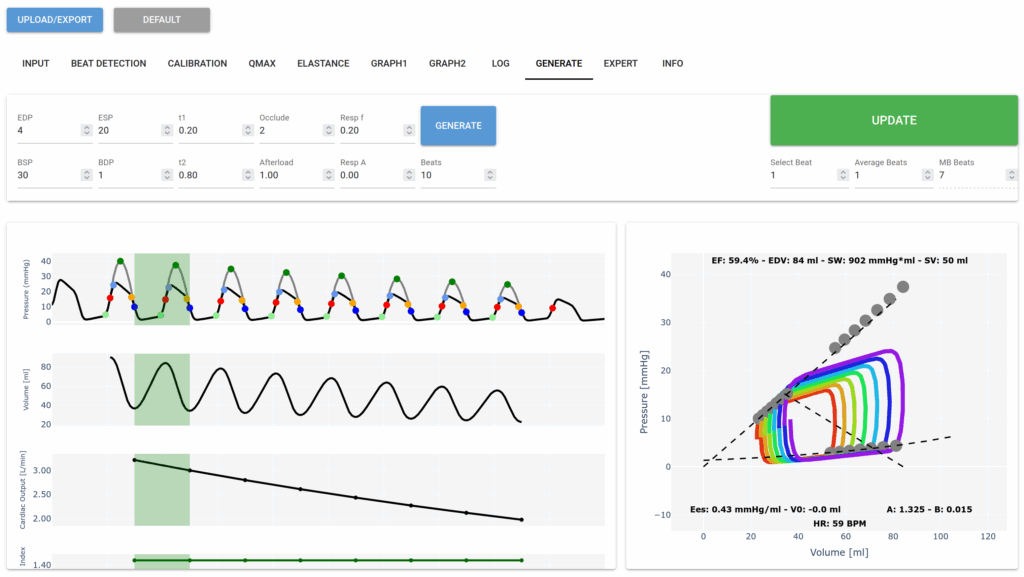
2. Dual-Graph Display: Pressure–Volume Loops
Users will now have access to a dedicated second graph for real-time visualization of pressure–volume loops—essential for assessing cardiac function and contractility.
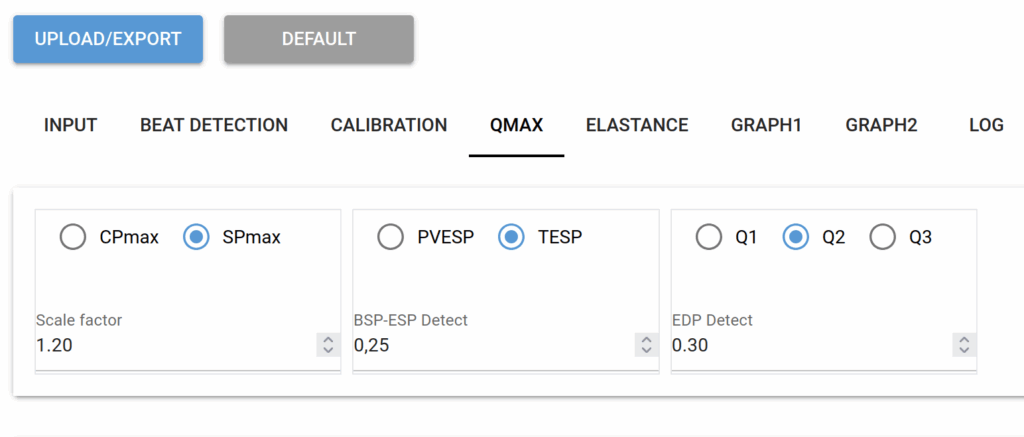
3. Advanced ESP and Pmax Estimation Methods
The analyzer will support additional methods for estimating end-systolic pressure (ESP) and isovolumic pressure (Pmax), offering greater flexibility and accuracy.
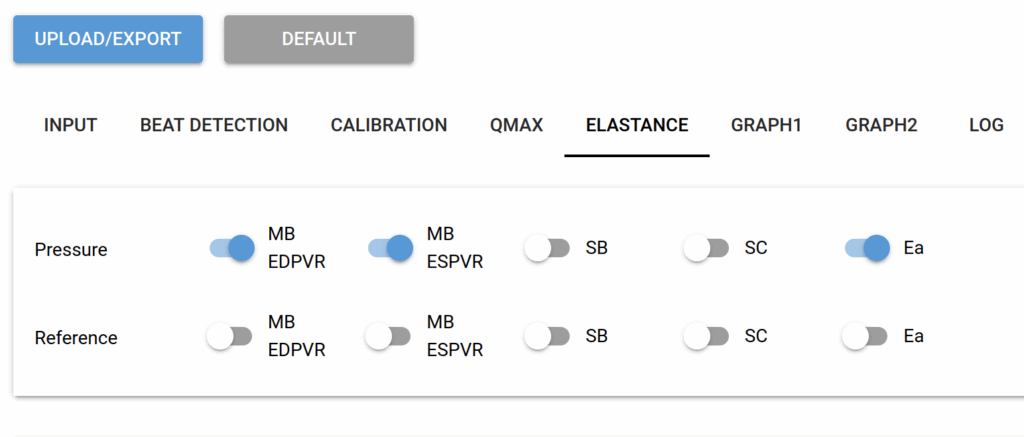
4. Elastance Curves with Single-Beat (SB) and Multi-Beat (MB) Options
To support comprehensive ventricular function assessment, the analyzer introduces elastance curve generation using both single-beat and multi-beat methodologies.
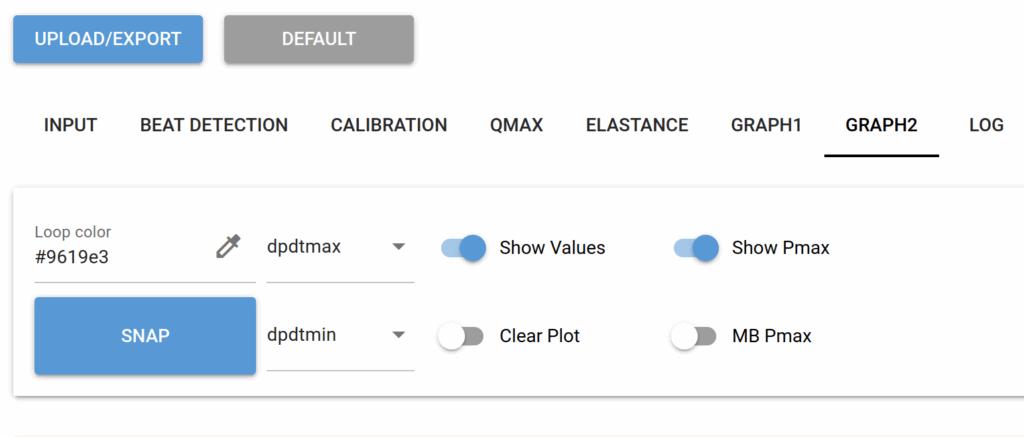
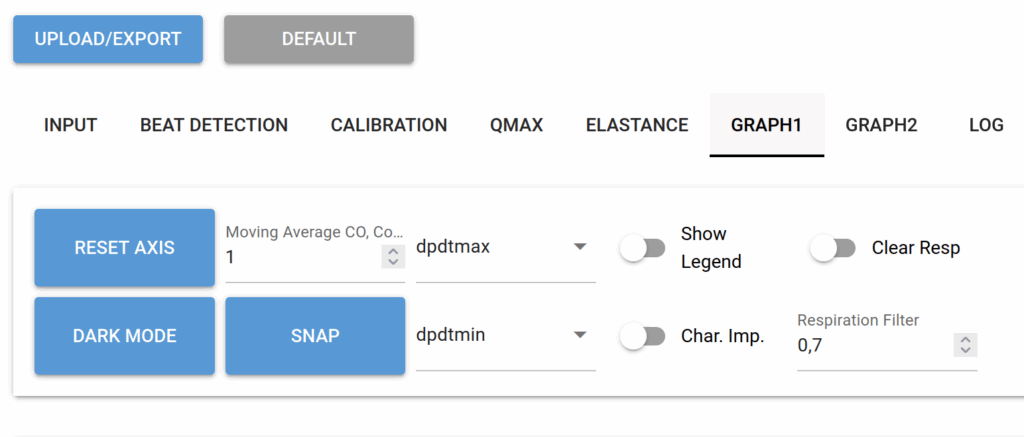
5. Customizable Graph Controls
A suite of new options will allow users to finely adjust graph appearance and scaling, improving clarity and aiding in the interpretation of complex waveform dynamics.
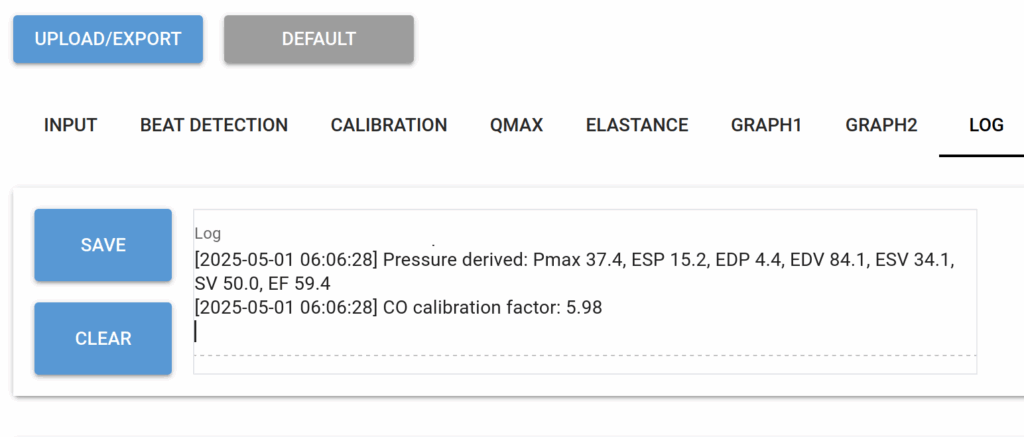
6. Integrated Analysis Log
Every analytical action performed in the session will be automatically documented in an internal log. This facilitates reproducibility, compliance, and auditability for research workflows.
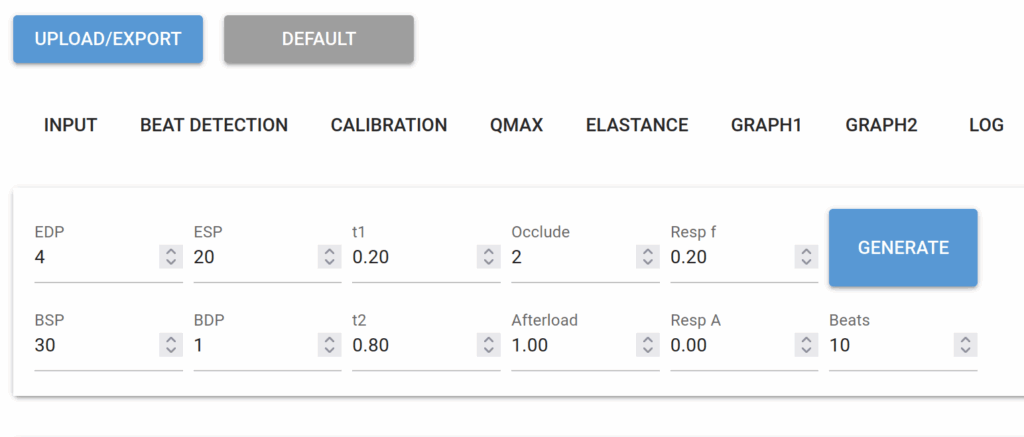
7. Waveform Generator for Testing
A built-in waveform generator will allow users to simulate and test various signal types—an invaluable tool for method validation, training, and development.
8. Broad Format Compatibility
To streamline integration, the analyzer will support import of signal data in all major standard formats, reducing friction in multi-platform workflows.
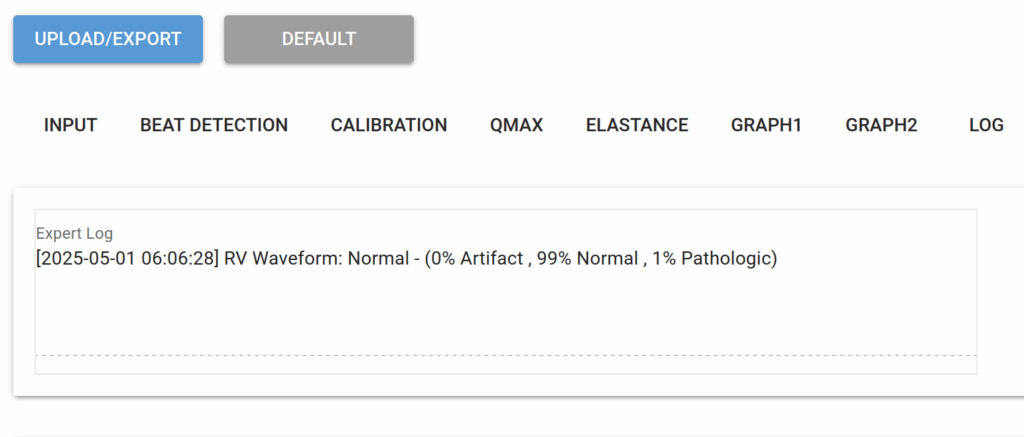
9. Expert Tab: Automated Waveform Commentary
The new Expert Tab delivers intelligent, automated commentary on waveforms—designed to support faster interpretation and streamlined documentation. This foundational feature marks the beginning of a broader integration of machine learning and AI capabilities into the analyzer.
Stay tuned for the release date, walkthrough videos, and technical documentation.